Implementing the Grammar of Graphics with {ggplot2}
Introduction to Data Science
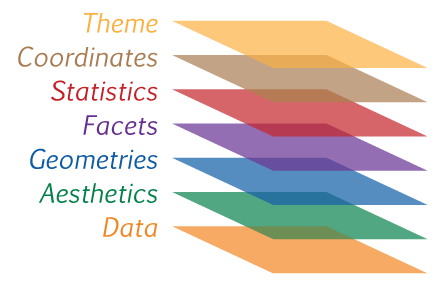
{ggplot2}
A package that implements a layered grammar of graphics
{tidyverse}
An opinionated collection of R packages designed for data science
All packages share an underlying philosophy and a common grammar
library(tidyverse)
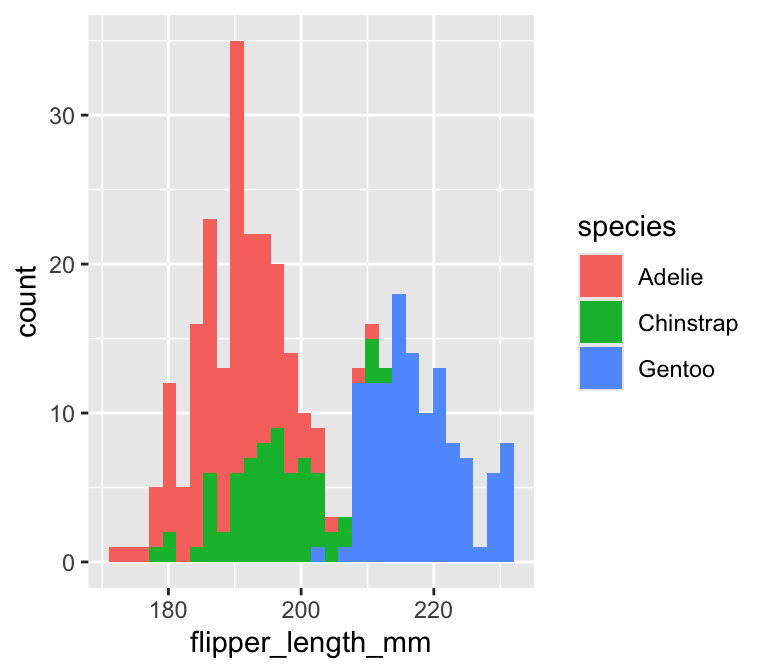
Example
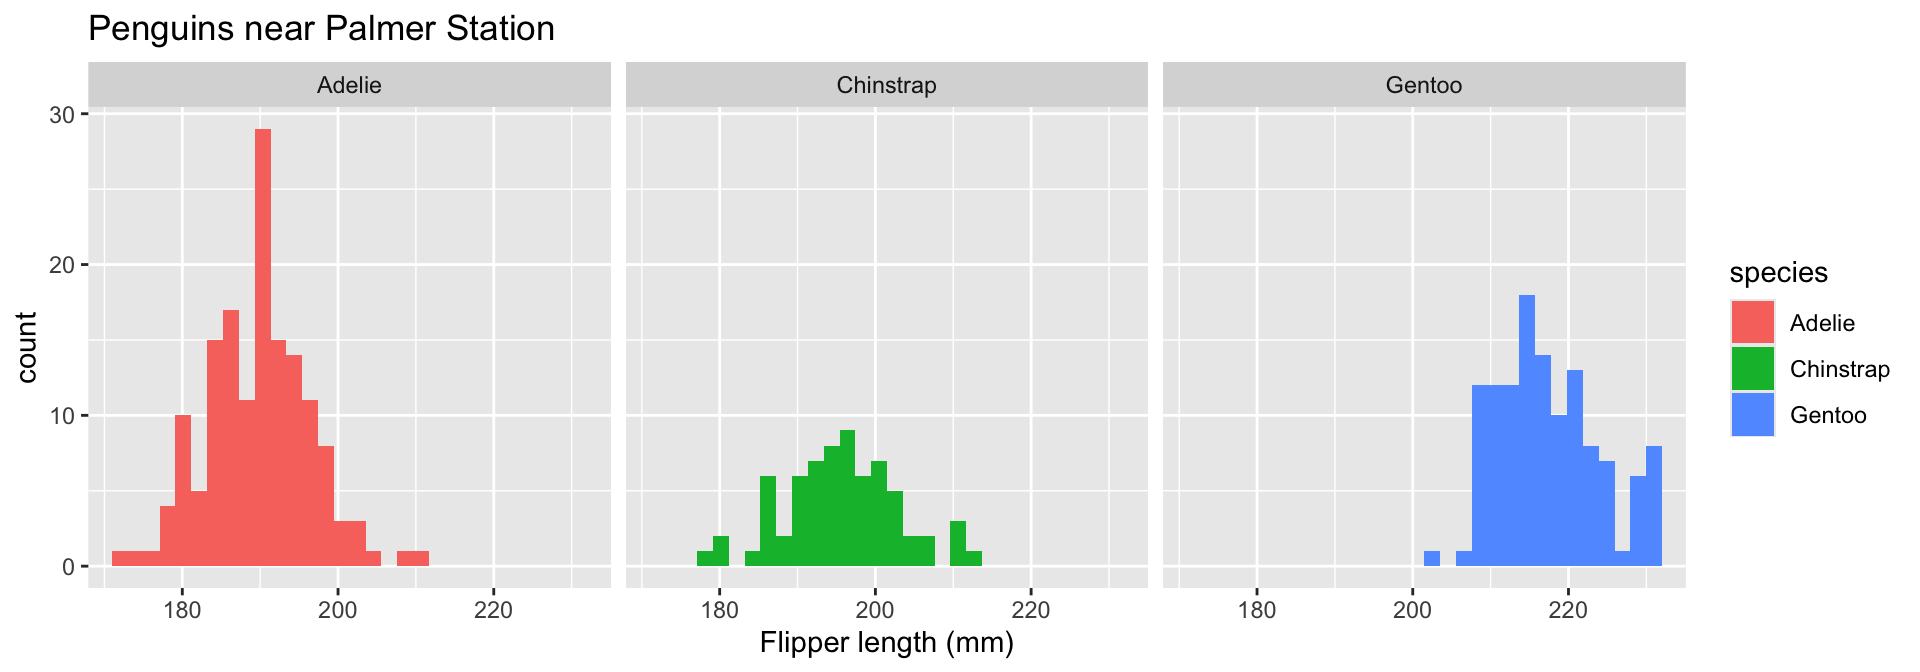
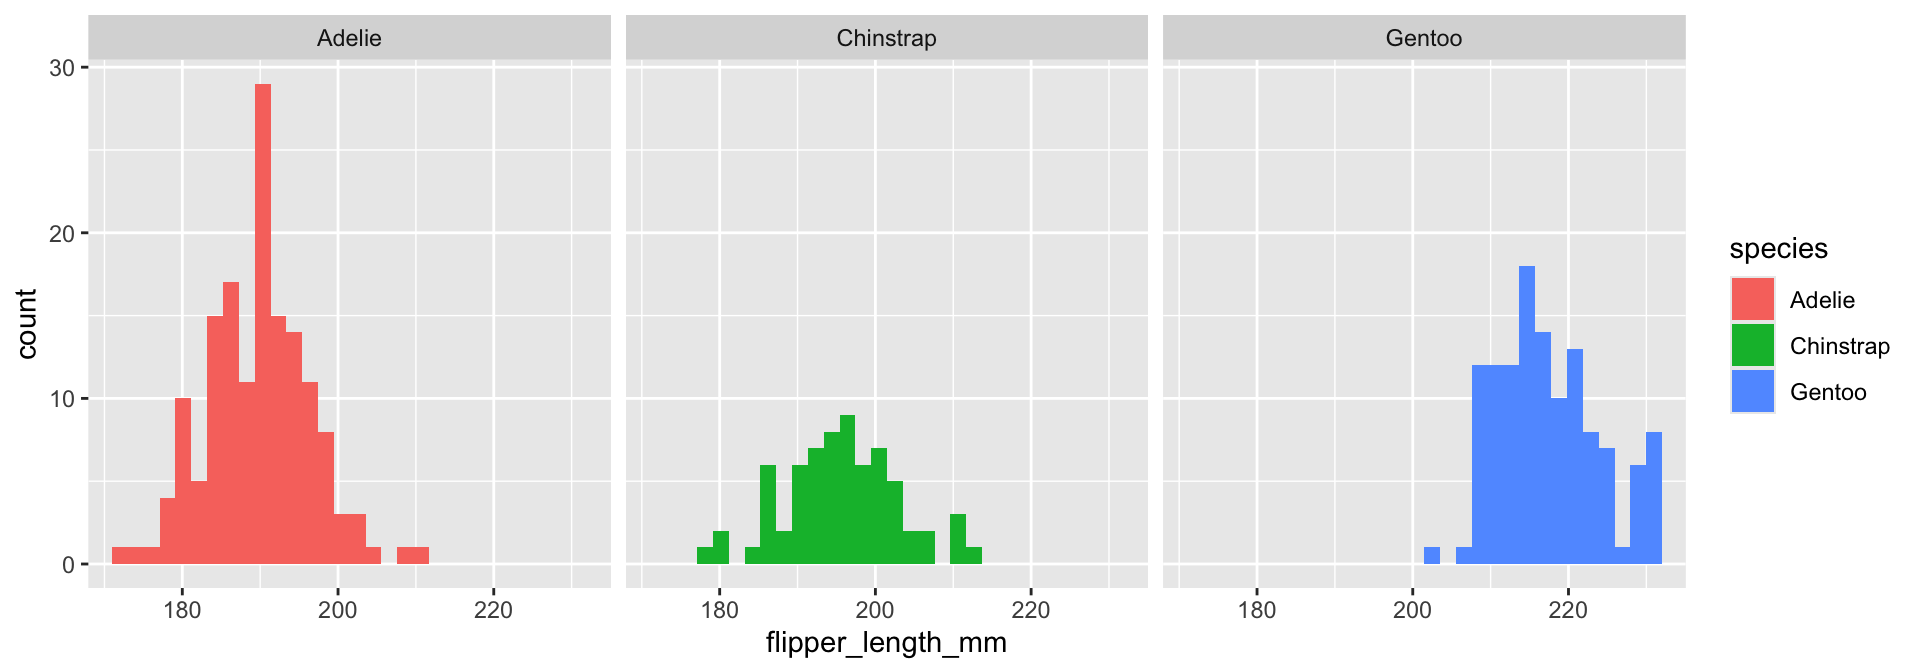
Facets
Small multiples are created through facets
Theme elements
Non-data components of the plot that can be modified with theme elements